Optimum7 is now using DashThis, a tool that simplifies the digital reporting process. As an instrument for easy reporting, DashThis automates the analytics reporting process, which ultimately allows Optimum7 to deliver thousands of dashboards every month to its clients.
At Optimum7, we’re proud of our marketing strategies and believe that in order for our clients to keep up with their performance levels, they should always be up-to-date on their progress. By delivering reports in an accurate and timely manner, Optimum7’s clients can see how our marketing strategies are efficiently coming into play.
A True Game-Changer
Before using this effective reporting tool, we found that our efficiency levels were being compromised since we were spending an excessive amount of hours creating monthly reports. Optimum7 was exporting analytics, AdWords data, and keywords data separately.
Now, Optimum7 just reports all analytics to each client using a single, customized platform that automatically merges all the data. Rather than spending hours on gathering data from multiple sources, DashThis does that for us.
In addition, clients can now refer to more attractive reports that can be understood more easily. Displaying everything from progress on conversions to leads and revenue, businesses can focus on what matters most to them. For instance, they can see how factors such as their return on investment (ROI), are being affected regularly.
Time Is of the Essence
DashThis’s numerous widgets allow Optimum7 to create the necessary charts and tables for properly displaying the information that clients need. Instead of distracting businesses with less prominent data, DashThis’s templates let us select the most resourceful dashboard layout for clients to spend time on what’s most important.
DashView lets you see data in three simple and short views: periodic, rolling, and campaign.
- Periodic view – Look at reports in a calendar format (weekly, monthly, annually, etc.). You can even browse past periods and save them for your reference.
- Rolling view – Get an instant shot of your current performance as a dynamic and changing view that focuses on the present.
- Campaign view – Look at the performance of an advertising campaign in a flexible manner by pitting it against a comparison period.
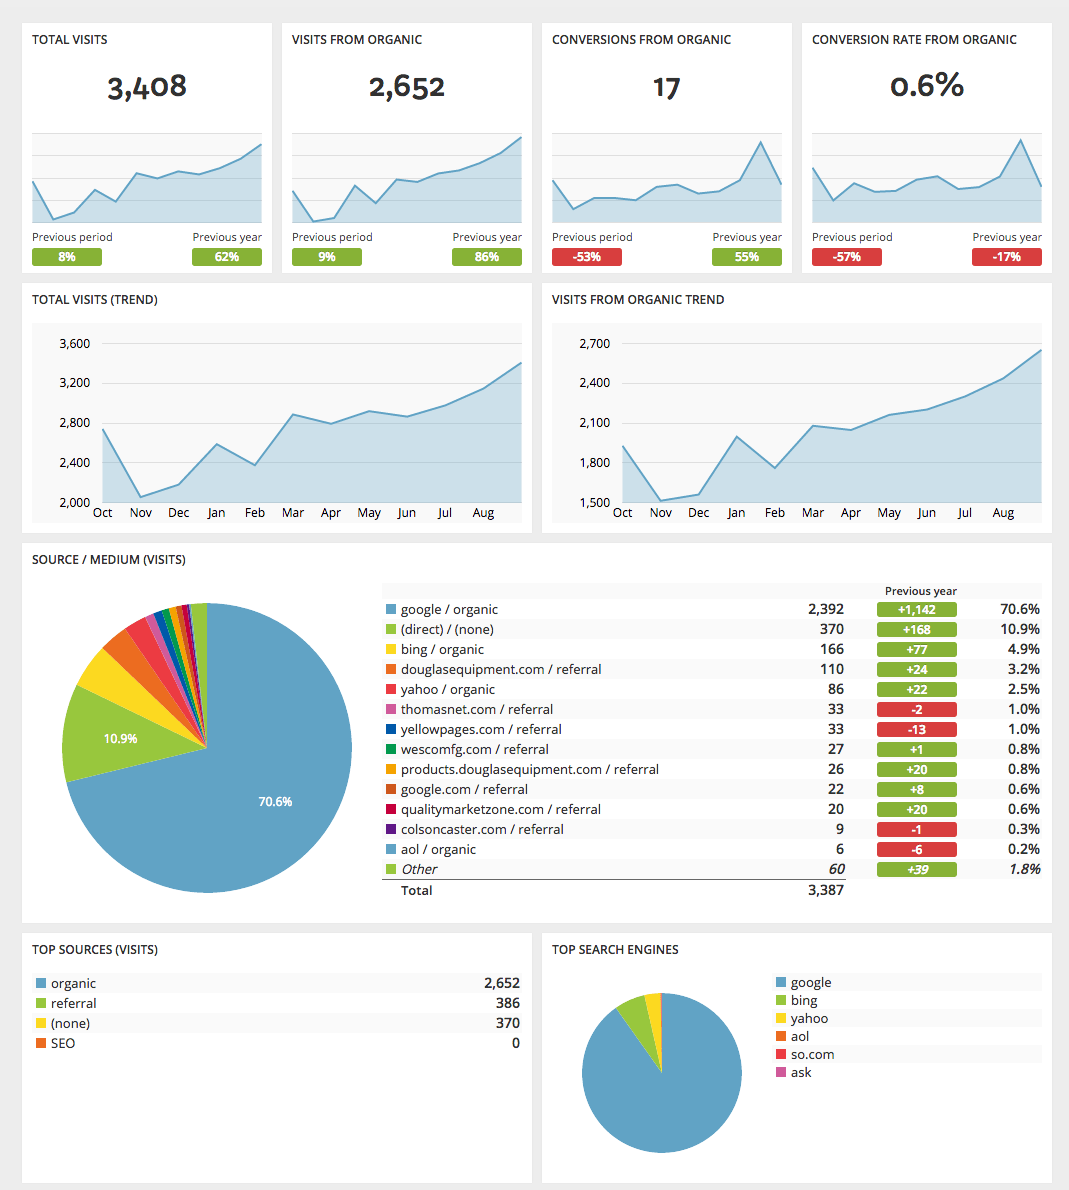
Here is an example of a periodic view:

Optimum7 can also comment and provide insight about the data directly on a client’s report page. This ultimately saves time on back-and-forth conversations. In addition, DashThis allows us to deliver timely reports to the right people, using scheduling strategies and mailing lists.
Why You Should Use It Too
By placing all sources in one place, we’ve found that DashThis has helped save us more time to focus on our client’s needs. The system includes CSV file support, which allows us to effortlessly upload external data.
Saving time also means saving money. DashThis has helped Optimum7 save hundreds of dollars a month, thanks to its simplified processes. For an annual fee of $595, we even have the option to use its white-label dashboard feature, which allows for replacing the standard DashThis url (show.dashthis.com) with one branded with our company’s name.
How Can DashThis Improve?
With every great instrument comes some room for improvement. Optimum7 has found that DashThis can enhance its processes by allowing a business’s multiple analytics data be displayed separately simultaneously. For instance, if a company has separate domains, their analytics data should be shown without merging each domain’s data into one final result.


