Google Analytics is a must-have tool for any online store owner. It gives insights into your customers’ behavior, allowing you to make better decisions and grow your business. Shopify is an e-commerce platform that powers over 2.1 million online stores and has been growing at an incredible rate, with a customer base that is expanding rapidly.
As a result, there are numerous opportunities for you to begin as a merchant on Shopify, which is simple. As a merchant, you’ll be able to create and customize your store quickly, use the included tools to manage your inventory and customers, and even create sales pages for marketing purposes.
But how do you integrate Shopify and Google Analytics into your online store? This guide will teach you everything you need to know about using Google Analytics and Shopify to run your business as smoothly as possible.
Why Should You Use Google Analytics?
Google Analytics is one of the best tools for understanding and optimizing your Shopify store or website. Before we learn how to use Google Analytics, we should understand why this tool is so important.
Your website’s visitors can be tracked using Google Analytics, a free tool. It gives you detailed information about where your visitors are coming from, what they do on your site, and how long they stay.
Your website’s different parts can also be assessed by setting goals.
For example, if you have an eCommerce site, you could set up a goal for each product page that tracks how many people add each item to their cart and purchase it. Google Analytics can also be used to track mobile traffic.
Google Analytics 4 is the latest version of Google Analytics.
Google will be phasing out Universal Analytics, and on July 1, 2023, your old Analytics account will stop receiving new website data. With this in mind, it is critical to make the transition to GA4 as soon as possible to avoid losing data.
GA4 features a complete redesign from the ground up. It has a new user interface with more features and a more user-friendly reporting section. The new version also includes improved eCommerce tracking (including advanced shopping events), faster performance, and better product recommendations based on your users’ behavior.
Difference between Google Analytics 4 and Universal Analytics
Google Analytics 4 (or GA4) and Universal Analytics are two different versions of the same service, but they have some key differences.
In GA4, almost everything is an event. So if you’re doing a page view, that’s an event. Any transaction and revenue data is also an event. An event enables you to track specific user interactions on a website or app.
The purpose of events in Universal is to track actions within a page. Events on GA4 send all types of data to your reports. You can find information about your website’s activities, users, and other information.
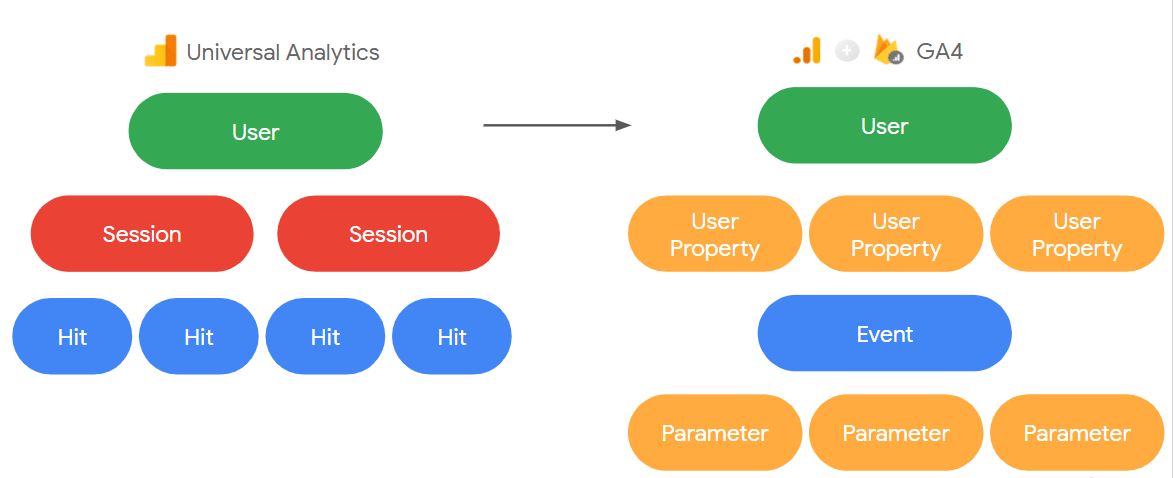
GA4 includes both an app and a web interface for data collection. So, for example, if you have a web application for eCommerce and a mobile app for iOS or Android, you can collect data from both in GA4. This was not possible with Universal Analytics because it is a web-only system. GA4 includes all of the modern features required for your current business with modern analytics.
GA4 has also changed some of the criteria for specific metrics. In Google Analytics 4, the bounce rate is the percentage of non-engaged sessions. In other words, the inverse of the engagement rate is the bounce rate. Universal calculates bounce rate based on the percentage of sessions where users viewed only one page and sent only one request.
Why Do You Need Google Analytics for Your Shopify Store?
Analytics for Shopify stores provide essential insights into your store’s performance, allowing you to make informed decisions about improving it. These insights include:
- How many people are visiting your site
- What pages are people most likely to visit
- Which products or themes get the most traffic, and what features do they like the most
- Which marketing campaigns are most effective
Shopify Analytics: Pros and Cons
Google Analytics and Shopify Analytics are both very powerful tools for measuring your website’s performance. However, if you are a small business owner with a limited budget, then using Google Analytics instead of Shopify analytics might be the better choice.
Google Analytics is similar to Shopify Analytics but has some key differences that make it a better option for small businesses. The most significant difference is Shopify Analytics does not come with all the available reports, such as the order and sales report. To access these features, you would need to upgrade to Shopify Plus.
Additionally, Shopify doesn’t provide as much information as Google Analytics, and it doesn’t allow you to drill down into data. For example, Shopify Analytics does not need a tracking code like the Google Analytics tracking tag. These are all reasons why Google Analytics is the industry standard.
How to Set Up Google Analytics on Shopify to Track Your Store’s Performance
This article assumes you are a Google Analytics Administrator or a Shopify admin account for a business or client site. If you aren’t, please get in touch with the site’s or organization’s owner before proceeding.
Preparing to Setup Google Analytics and Upgrade Universal Analytics
Before you can use GA4, you need to upgrade your existing analytics account. The steps for upgrading depend on how far along you are in setting up Google Analytics.
Upgrading from Universal Google Analytics
If you have a pre-existing Google Analytics tracking id on an old version of Google Analytics, then follow these steps:
- Remove the old tracking code from all pages of your website. This will ensure that no data is collected in both versions at once.
- Please Note: This might not be needed as Universal will stop collecting data in the future.
- Create a new property for Universal Analytics and add it to your existing account by going to > Admin > Property Settings > Add Property.
Adding Universal Analytics to Shopify
There are several ways to connect Universal Analytics to Shopify. The first method is integrating Universal Analytics into your Shopify store and adding your tracking code. This will allow you to track all your website traffic and see conversion rates for each page.
The other way is to use a third-party service called Google Tag Manager (GTM). GTM allows you to set up tags like goals and pixels without directly editing the code on your website.
It also allows you to test out new tags without worrying about breaking anything else when making changes. We won’t discuss connecting Universal Analytics since GA4 is the latest version.
How to Set Up Google Analytics 4 on Shopify
To set up Google Analytics for Shopify, you’ll need a Gmail account. Once you’re logged into Gmail, follow this step-by-step guide:
- Create a Google Analytics Account
- Add a Property to Your Account
- Create a Data Stream
- Install the Piece of Code on Your Website
Step 1: Create a Google Analytics Account
Log into your Google Analytics account using Gmail and you will be at the Google Analytics dashboard. After that, you will need to add a property to your account.
Step 2: Add a Property to Your Account
Next, please select a name for your property and enter it in the box. You can also choose whether or not users have access to this property by checking or unchecking boxes next to each setting as desired (we recommend leaving both checked).
Finally, click Create Property and wait until it’s ready!
Multiple properties can be tracked using the same Google Analytics account. You can track your online store, mobile app, and blog. You can access these accounts in Google Analytics’ Admin section by clicking the gear icon in the bottom left.
Step 3: Create a Data Stream
Making a data stream is new to Google Analytics 4. Streams are a source of data for your properties. You can find this option after going to the admin section of Google Analytics.
Once you have clicked on the stream icon, you will see a new page. On this page, you can press “Add stream.” Select the icon that best fits your needs, and you will now see a new window where you can enter your website URL and the name of the Stream you are making.
Once you have entered the necessary information, the window will extend. Copy the code by the tab titled “Global Site Tag.”
Step 4: Install the Piece of Code on Your Website
This task might seem daunting, but it is simple if you follow our steps. Log into your Shopify account and go to “Online Store” from your Shopify dashboard. Once you have done that, go to “Themes,” “Actions,” then “Edit Code.”
You can now go to layout and find the header tag. Once you have found this, you can paste the code from Google in the header section. After doing this, remember to save.
Understanding Google Analytics
Now that you’ve linked Google Analytics to your Shopify account, it’s critical to understand Analytics’ metrics and reports to get the most out of it.
Reports in Google Analytics
The different reports in Google Analytics are:
- Acquisition
- Engagement
- Monetization
- Retention
Understanding the Data: Acquisition Section of GA4
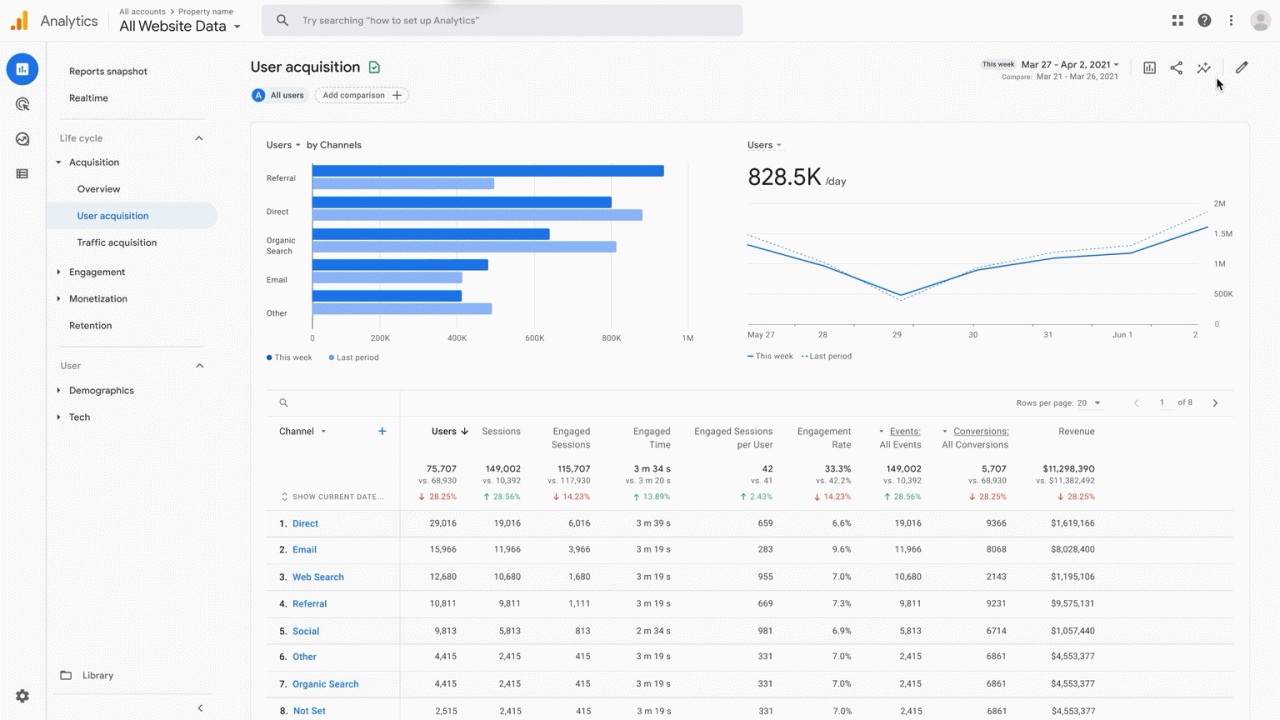
Acquisition reports are an important section of your analytics. They show how users find your website and are a great way to identify new users and returning customers.
There are two types of acquisition reports: User and Traffic. The Acquisition section shows where you are getting your traffic.
This information is split into five different categories (Direct, Organic Search, Organic Social, Referral, and Unassigned). Understanding which channels are working can help you make better decisions about where to focus marketing efforts in the future.
Understanding the Data: Engagement Section of GA4
GA4’s Engagement section assists you in better understanding how people interact with your content. It also reveals which parts of your site are the most popular, and how frequently users interact with specific areas.
Furthermore, this section can provide information on where users are clicking on your site. This can help guide your design decisions and determine if something is missing from your interface that could provide an opportunity for better engagement.
Finally, the Engagement section is helpful in determining where users may have difficulty navigating or viewing content on the page.
Understanding the Data: Monetization Section of GA4
The Monetization section of Google Analytics is a great way to see how your website is performing in terms of revenue. It’s one of the few sections where you can see exactly how much money your site is making.
This can be very useful for eCommerce stores. You can now see information about items in carts as well as views of specific items. You can even get detailed information about ad revenue data as well.
Understanding the Data: Retention Section of GA4
Google Analytics retention section is a great way to learn how long your visitors stay on your site after they arrive. This data can be helpful when determining which parts of your website are most effective at keeping visitors engaged and where you may need to improve.
The retention report displays the percentage of users who return to your site within a specified time frame after their initial visit. The default time is 30 days, but this can be changed if necessary.
Metrics in Google Analytics
Sessions
This is the number of times someone visits your website within a given time (e.g., day, week, month, etc.).
You can also see this metric in Google Analytics as “Unique Visitors.”
Visitors
This metric shows how many people visited your store during one day or week on average (e.g., based on their IP address). You can also see this metric in Google Analytics as:
- “Visits,” or total visits across all pages
- “Unique Visitors,” or those pages where customers performed actual conversions after completing checkout forms (such as ordering products online)
New Users
New users are people who have visited your website for the first time. They’re not former customers, but they may be interested in becoming one.
New users are valuable because they are potential customers who will likely return and make another purchase from you. They can also be a good indicator of the effectiveness of your marketing efforts.
If many unique visitors come from social media channels such as Facebook or Twitter, then a lot more work is being done behind the scenes to promote those sites.
Sessions Per User
The duration of a session is the amount of time a visitor spends on your website. The length of a session is typically measured in minutes and hours, but it can also be measured in seconds.
The average session duration for a single user visiting your store may vary depending on how quickly they can navigate their browser, what type of device they’re using, mobile device or desktop, and other factors.
It’s important not to assume that one person’s session will look exactly like another person’s session. What matters is that you have some idea of what those sessions look like so you can make informed decisions when it’s time to optimize them.
Page Views Per Session
Page views per session are the number of pages a user views in a session. This key metric helps compare the number of pages viewed by new and returning visitors and users from different sources.
For example, suppose you see that your site traffic has increased by 20%, but only 10% of your traffic comes from organic search results. In this case, it could mean that something else is happening within your site that might be causing people to visit more often.
Bounce Rate
Bounce rate is the percentage of single-page sessions. It’s a critical metric you need to track to understand how people interact with your site and what they want from it. A high bounce rate might mean users are not getting what they want from your website and immediately leave once on your page.
Percentage of New Sessions (New Users)
The Percentage of New Sessions measures the time a user spends on your website before converting. This can help determine how new users are converting and what you need to do to improve their experience on your site.
This metric also shows how many visitors have viewed your site within a specific time frame. It’s also important because it shows us if there are any shortcuts in our conversion funnel, which means we should look into improving them.
As with all key metrics, it’s important for marketers because it gives insight into how things work behind the scenes when someone visits our store or app. There are three main pieces here:
- What types of content get clicked on most often.
- Whether or not anyone buys anything after visiting.
- Whether or not there was enough time spent browsing around before deciding
- Whether or not this was worth spending more time with rather than purchasing something outright.
Funnel Exploration Report in Google Analytics 4
The Funnel Exploration report visually represents user behavior on your website. It shows how users move from one page to another, and it can be used to identify the most common paths customers take through your site.
You can even make custom reports to dive into the data your own way.
These custom reports come with all the metrics you would normally see. You can find this feature by going to the explore section of the Google Analytics dashboard and clicking on the “Create a new exploration” section.
Multi-step funnels analyze user journeys by breaking them down into smaller, more easily digestible steps. When looking at multi-step funnels, you can explore specific user journeys and determine how different users interact with your product or service.
To improve a website’s conversion rate, you might want to look at how many people visit the site and then convert. You can also look at how frequently people visit the site and how long they stay there before converting. This will help you determine what needs improvement to increase conversion rates.
How Does Shopify Track Sales in Google Analytics?
Google Analytics is a fantastic tool for tracking your website’s performance. However, you may wonder how to track sales in Google Analytics using Shopify. Luckily, Shopify’s integration with Google Analytics makes it easy.
So, what exactly does this integration mean?
Using Shopify to manage your online store, you can track customer purchases using Google Analytics. This means that when someone purchases something from your store, whether a product or a piece of clothing, you’ll be able to see where they are and how much they spent on whatever they purchased.
You can also set up customer emails and notifications to keep tabs on potential customers who have shopped at your store but might not have bought anything yet. Because Shopify provides customer management tools such as refunds, returns, and gift cards, Google Analytics shows you which customers are returning items or requesting refunds after purchasing them.
Google Analytics Can Help You Grow Your Business
That’s all there is to it! Now you can start tracking Google Analytics in your Shopify store. You can also use the information from this guide to create dashboards that will significantly help you understand how your customers interact with your site.
Learn more about your customers’ online behavior by investigating Google Analytics. Then, use this information to customize your store to better meet their needs.
You can design a marketing strategy catered explicitly to each customer group by knowing your sales, conversion rate, traffic sources, and products. Concentrate on those channels while making adjustments elsewhere if you know which ones generate the most revenue.
For help growing your website, contact Optimum 7 today.

